Notes from a weekend experiment.
I was exploring a system design for a platform that runs user functions on demand, something like AWS Lambda.
Some questions I wanted to answer with these experiments:
- How many function instances could share one bare-metal server?
- How would p99 response time change as more instances were added, and how far could this scale within a strict latency SLA?
The setup #
A comparable AWS reference configuration is m6i.metal.
| Instance | vCPUs | Memory | Storage | Network bandwidth | EBS bandwidth |
|---|---|---|---|---|---|
| m6i.metal | 128 | 512 GiB | EBS-only | 50 Gbps | 40 Gbps |
The workload was NMT, running in Docker containers managed by Kubernetes. OpenFaaS handled function deployment and invocation. The design kept the control plane separate from the worker running the functions.
The versions were OpenFaaS 0.8.5, Kubernetes v1.15.2, and Docker 19.03.1.
The workload assumption was that all deployed functions would be serving requests at the same time. More function instances were added by updating the Kubernetes deployment configuration. Existing functions kept serving requests as the new instances started.
The experiment reached 468 deployed function instances on one worker.
Response time at scale #
p99 is the response time at or below which 99% of measured requests finish. The question here was how that response time changed as the server filled up.
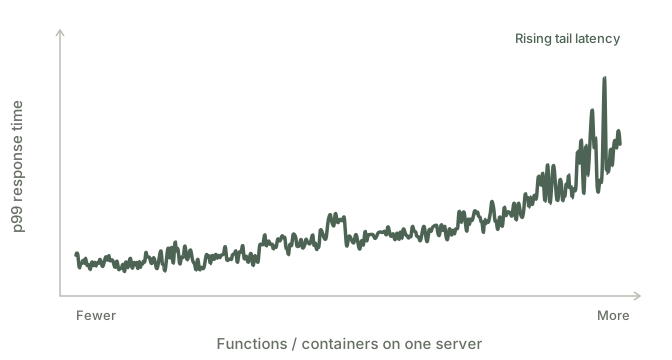
The curve rises slowly at first, with small fluctuations. Further along, p99 starts rising faster and the spikes get larger.
Those larger spikes matter when p99 has to stay below a promised limit. The server reached 468 instances, but the deployment count alone doesn’t tell us how many could meet that limit.
Cold-start breakdown #
Another part of the experiment was to break down cold-start time, from creating a pod to getting the first NMT response.
A cold start needs a new execution environment and function initialization. Here, a warm or hot function means its runtime and handler context are already initialized and can be reused for another request.
The script deployed through the OpenFaaS CLI, waited for an available replica, and then called the function. These timings cover the cold start through the first response, separate from the response-time curve above.
The path had four stages:
- Pod and container creation: Kubernetes brings up the pod and its Docker container.
- Server startup: the process serving function requests starts inside the container.
- Context loading: the handler initializes the state it needs before execution.
- Execution: the handler runs the NMT workload.
Docker container creation sits inside the Kubernetes pod-creation interval. Adding a separate Docker time would count some of the same time twice.
Cold-start path · first / 468th function. Boxes show stage boundaries, not a time scale.
Cold starts: the first and 468th functions #
For the first function, the cold-start path through the first response took 15.1 seconds. By the 468th, it took 27.5 seconds.
| Function | Pod + Docker | Server | Context | Execution | Total |
|---|---|---|---|---|---|
| First | 7 | 5 | 2.7 | 0.4 | 15.1 |
| 468th | 11 | 12 | 4.1 | 0.4 | 27.5 |
Server startup alone grew from 5 to 12 seconds. Pod and container creation went from 7 to 11 seconds, and context loading from 2.7 to 4.1 seconds.
The execution stage still took 0.4 seconds in both examples. All of the extra 12.4 seconds went into the work before execution.
Discussion
View discussions on GitHub