understanding: system-profiles
Efficient CPU usage is critical for system performance, especially in production environments. And by CPU usage, i do not mean looking at avg load using top or avg cpu util across cores with htop. We’re speaking of a metric that’s down to metal - CPU cycles.
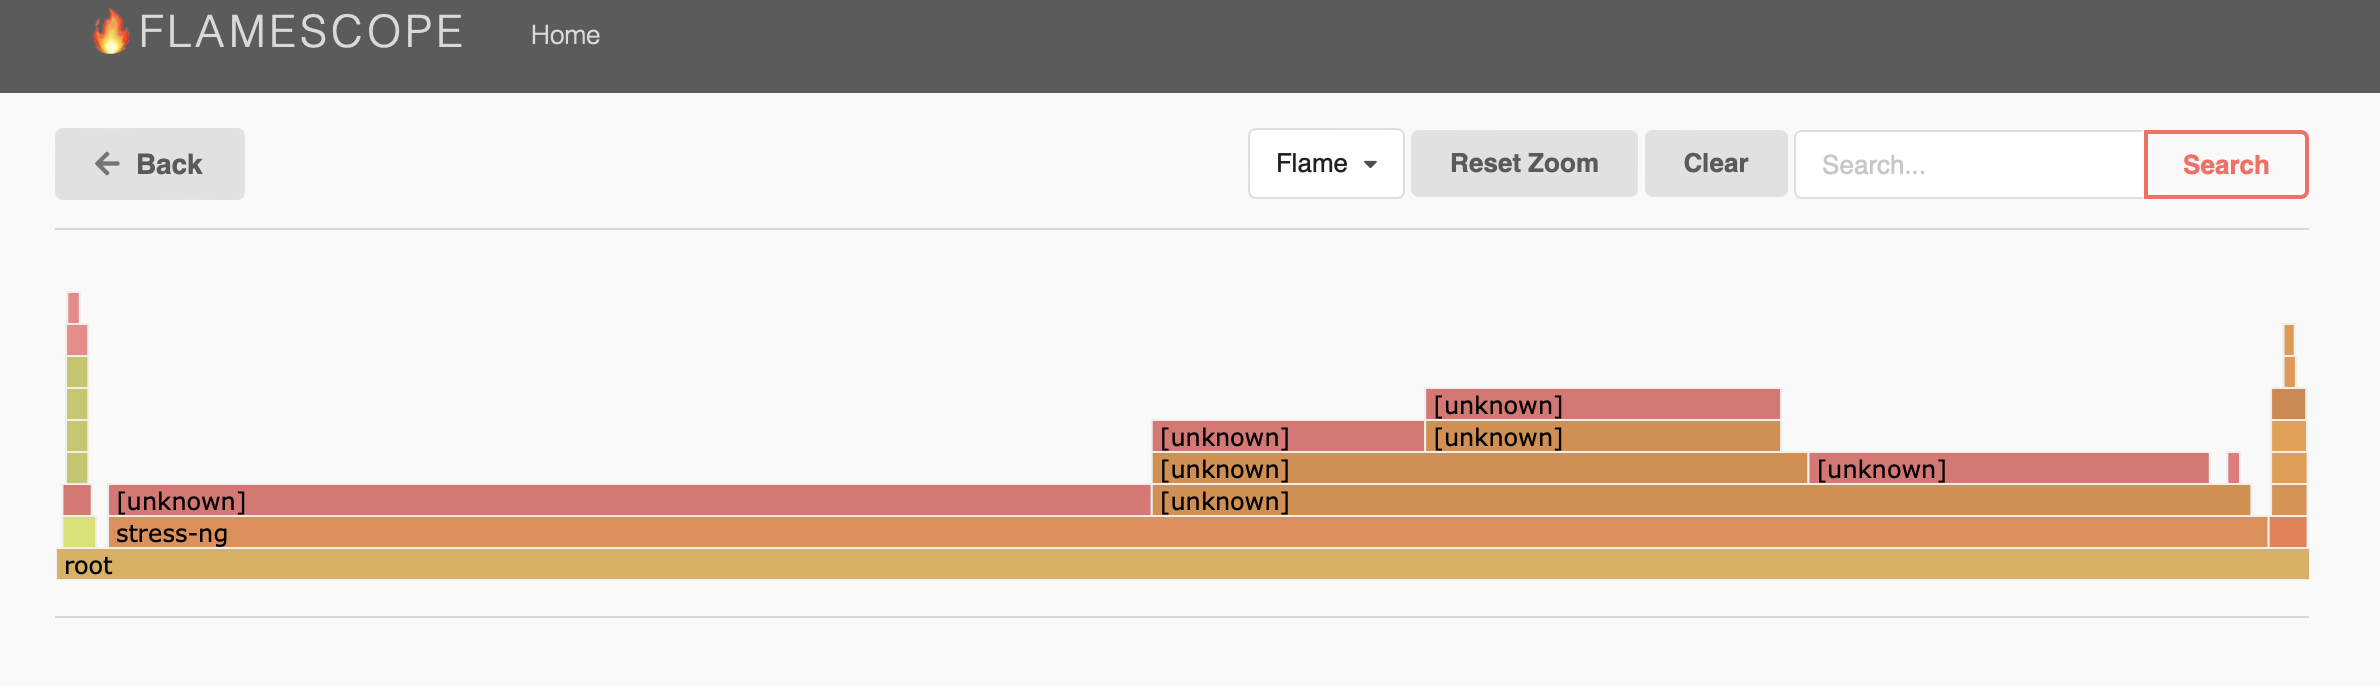
Understanding how your system utilizes CPU cycles can reveal bottlenecks and optimization opportunities. And the two powerful tools for visualizing and analyzing CPU performance are Flamegraphs and Flamescope, with profiles collected using Linux perf.
Step 1: Install Linux Perf
First, we need to ensure that linux-perf is installed on your system. If it’s not installed, use the following command to install it:
sudo apt install -y linux-tools-$(uname -r) linux-cloud-tools-$(uname -r)
Step 2: Collect Performance Data
To analyze system performance, we need to collect profiling data. Use perf to record data system-wide over a period of 60 seconds:
$ sudo perf record -F 49 -a -g -- sleep 60
here,
-F 49: Specifies the sampling frequency (49 Hz in this case).-a: Collects data across all processes.-g: Records call graph (stack trace) information.
you can explore additional commands and scripts here - https://github.com/swap357/perf-analyzer/blob/main/analysis.ipynb
Step 3: Generate a Readable Profile
Once the data collection is complete, perf generates a perf.data file. To convert this into a readable format that Flamegraphs and Flamescope can use, execute:
$ sudo perf script --header > /tmp/profiles/stacks.myproductionapp.stack1
To make storage and transport easier, consider compressing the output file:
gzip stacks.myproductionapp.stack1
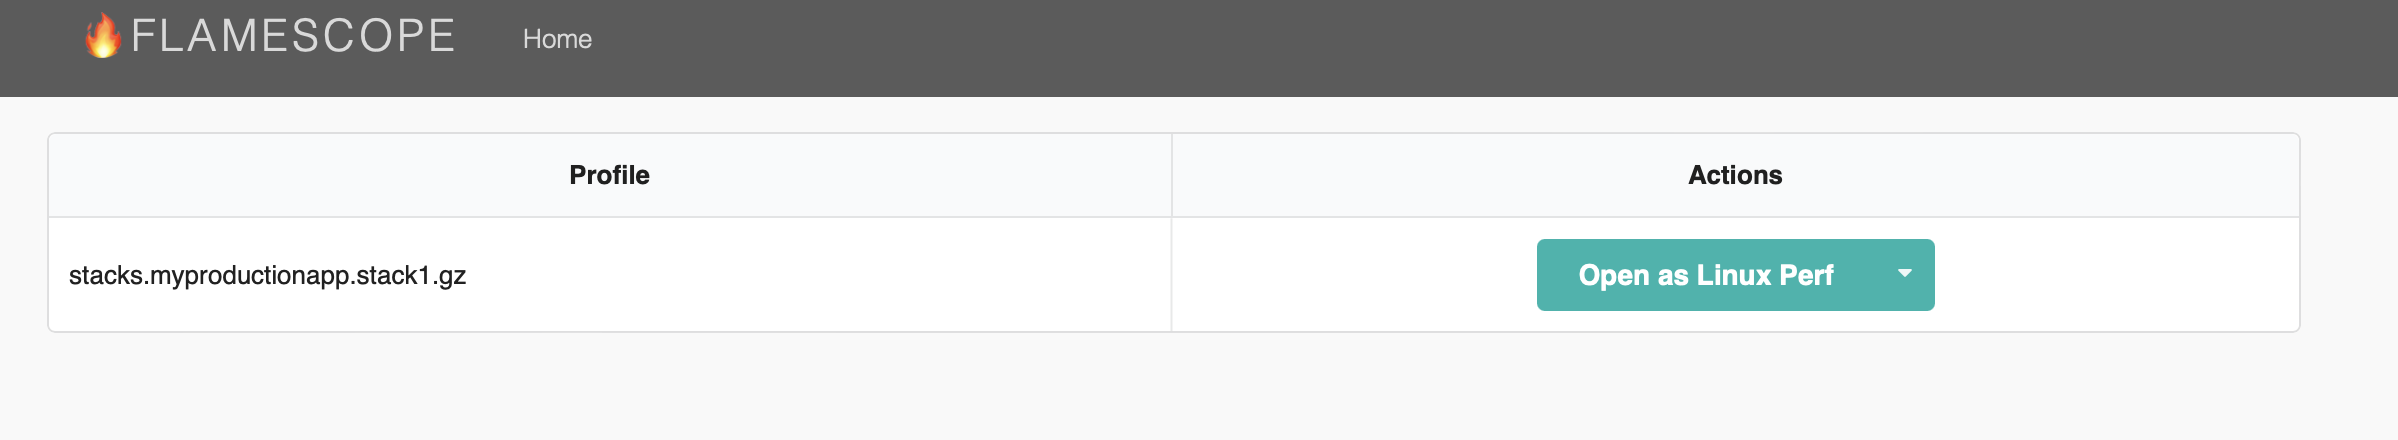
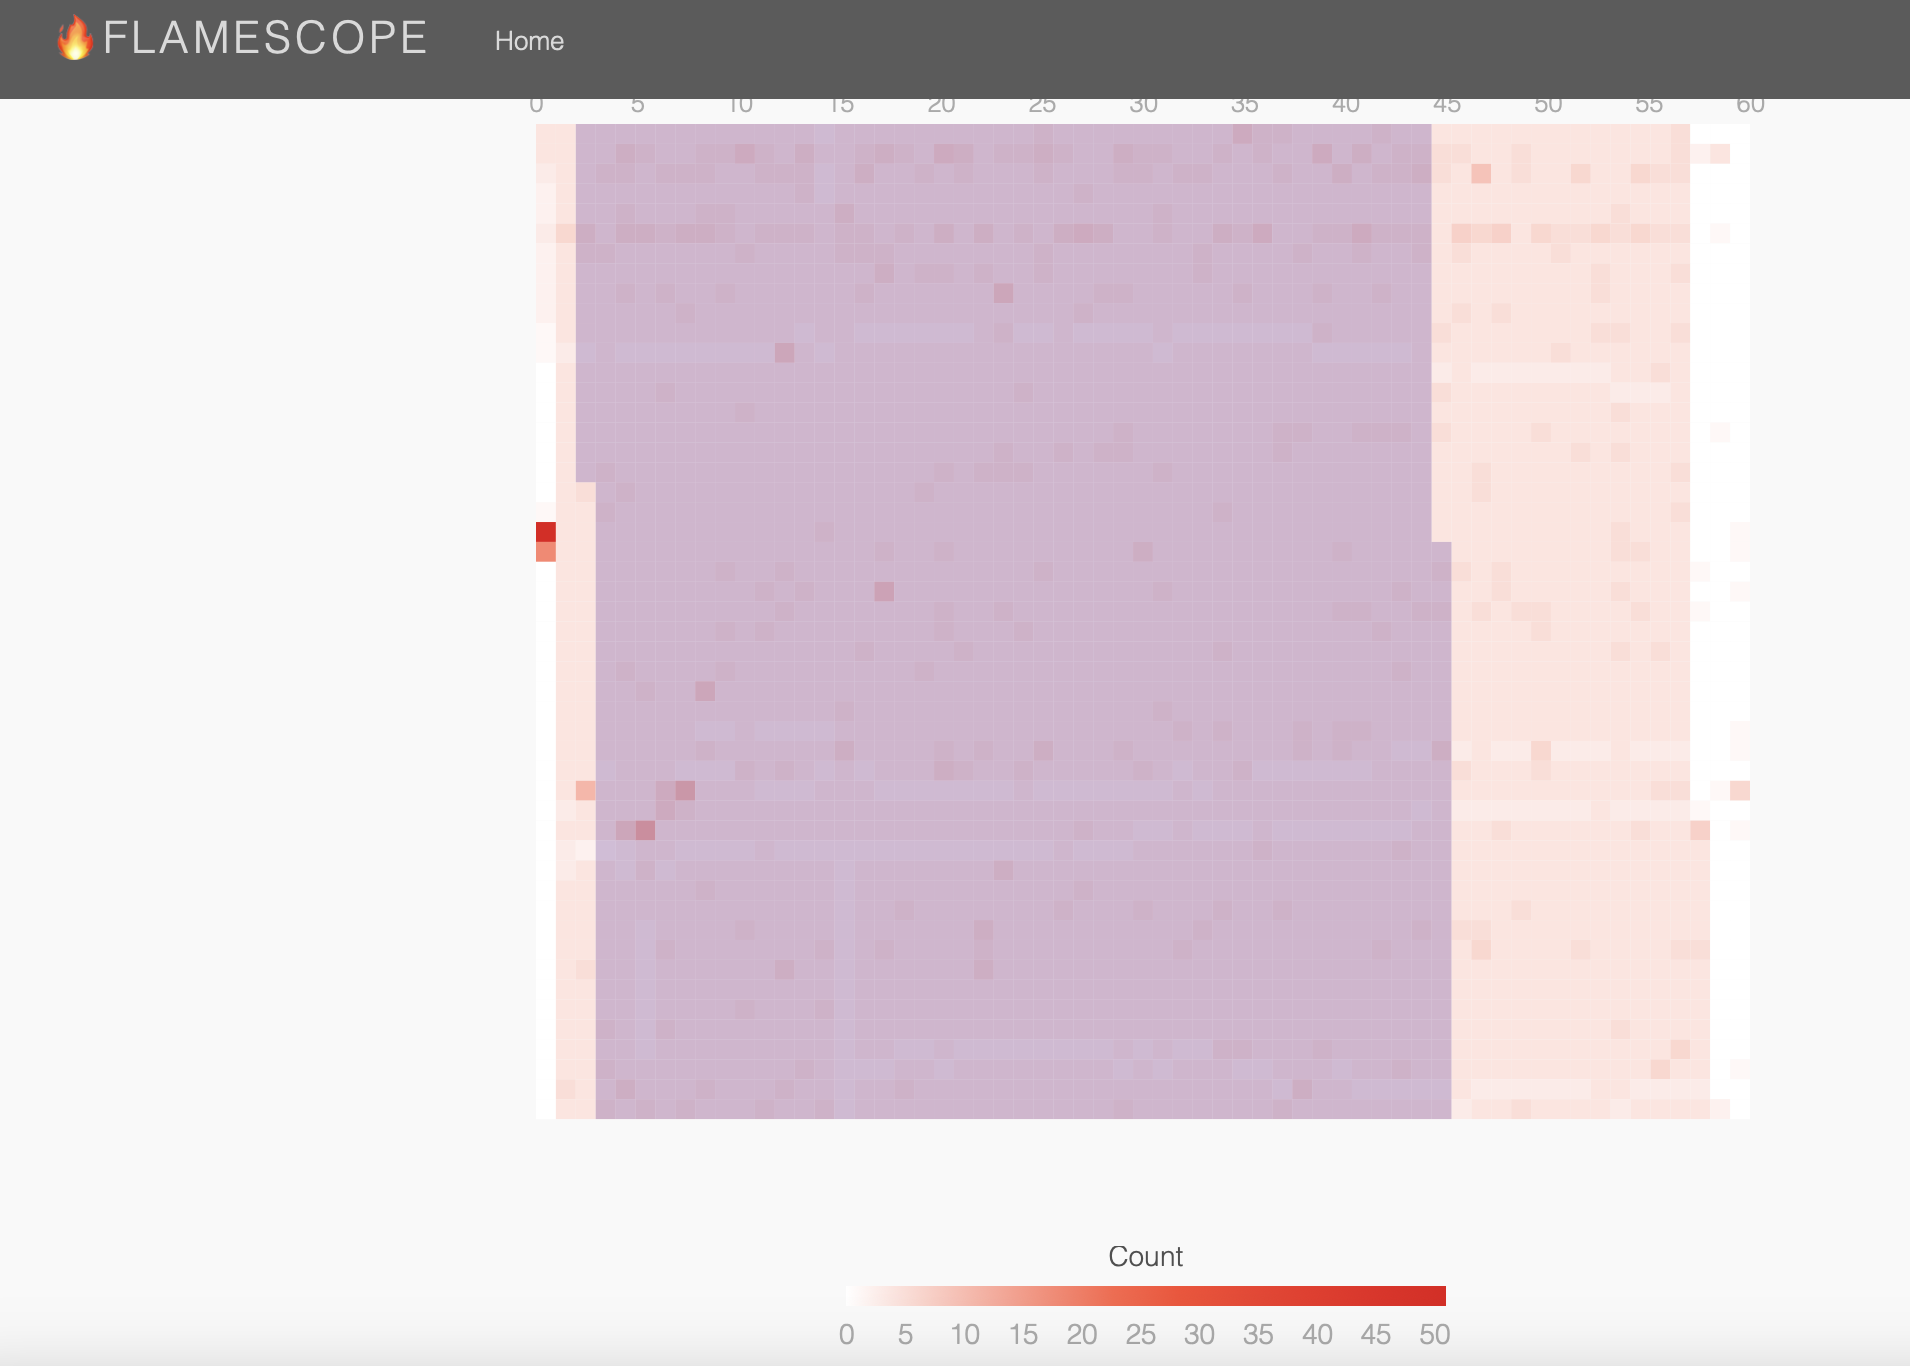
Step 4: Visualize with Flamescope
To visualize the collected data, use Flamescope. I’ve a containerized setup for Flamescope, and you can use the same:
$ docker run --rm -it -d -v /tmp/profiles:/profiles:ro -p 5000:5000 swap357/flamescope
This command starts Flamescope and maps the profiles directory into the container in read-only mode. The web dashboard should now be accessible at <serverIP>:5000.
Toolbox
some more helpful commands-
## CPU
# Basic CPU profiling
sudo perf record -F 99 -a -g -- sleep 60
sudo perf report

# Profile a specific process
sudo perf record -F 99 -p $(pgrep myapp) -g -- sleep 60

# Profile specific CPU events
sudo perf record -e cpu-clock,page-faults -a -g -- sleep 60

# Real-time CPU usage
perf top

## Memory
# Memory usage overview
free -h

# Detailed memory usage by process
ps aux --sort=-%mem | head

# Generate memory flamegraph
sudo perf mem record ./myapp

## Network
# Monitor network traffic
iftop

# Detailed network statistics
netstat -tuln

# Network I/O by process
iotop -o

# Generate network flamegraph
sudo perf record -e net:net_dev_xmit -a -g -- sleep 60

## IO
# I/O operations by process
iotop

# Generate I/O flamegraph
sudo perf record -e block:block_rq_issue -a -g -- sleep 60

## All together
# Profile CPU, memory, and I/O together
sudo perf record -e cpu-clock,page-faults,block:block_rq_issue -a -g -- sleep 60