project: profile-explainer
Worked on this at the Mistral Hackathon @ Shack15, SF, March 23-24 2024.
A tool that takes in linux perf profiles and generates step by step explanation with the flamegraphs.
Premise for the tool:
The tool is designed to bridge the knowledge gap between system experts and high-level engineers by providing a user-friendly interface to analyze perf profiles through flamegraphs. Here’s how it works:
- Input Perf Profiles: Users can upload their Linux perf profiles directly into the tool.
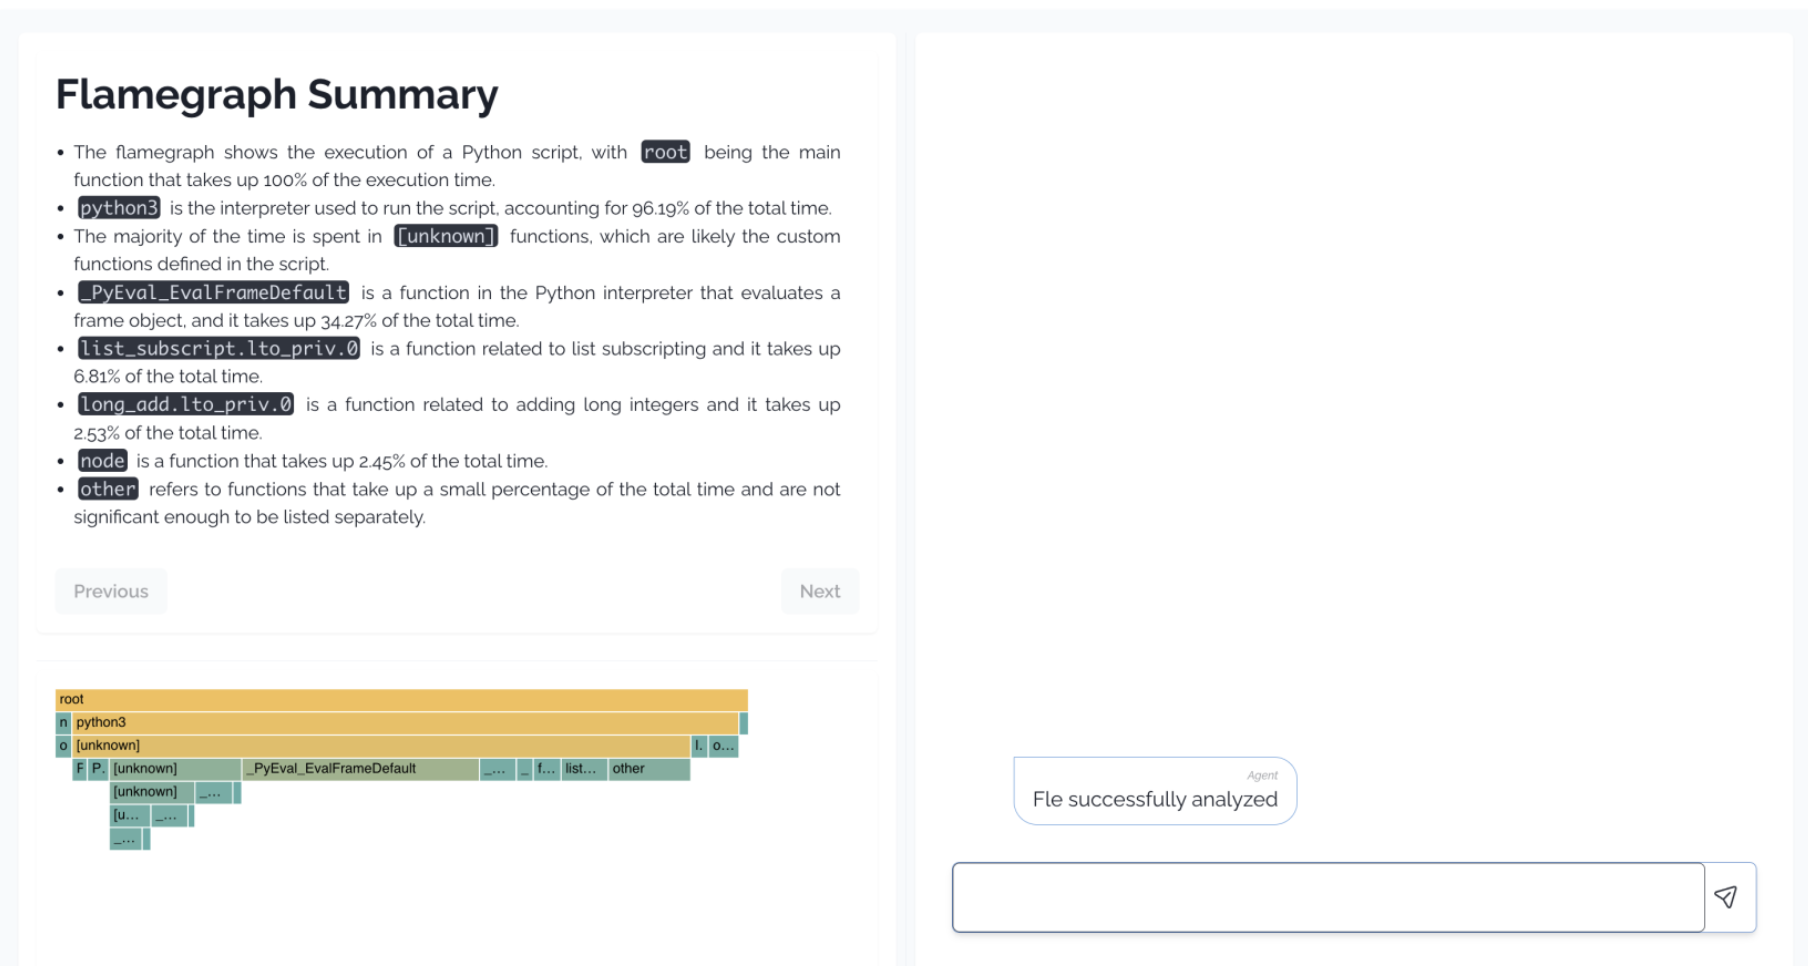
- Generate Flamegraphs: The tool processes the perf profiles to generate flamegraphs, which visually represent the call stacks and their respective execution times.
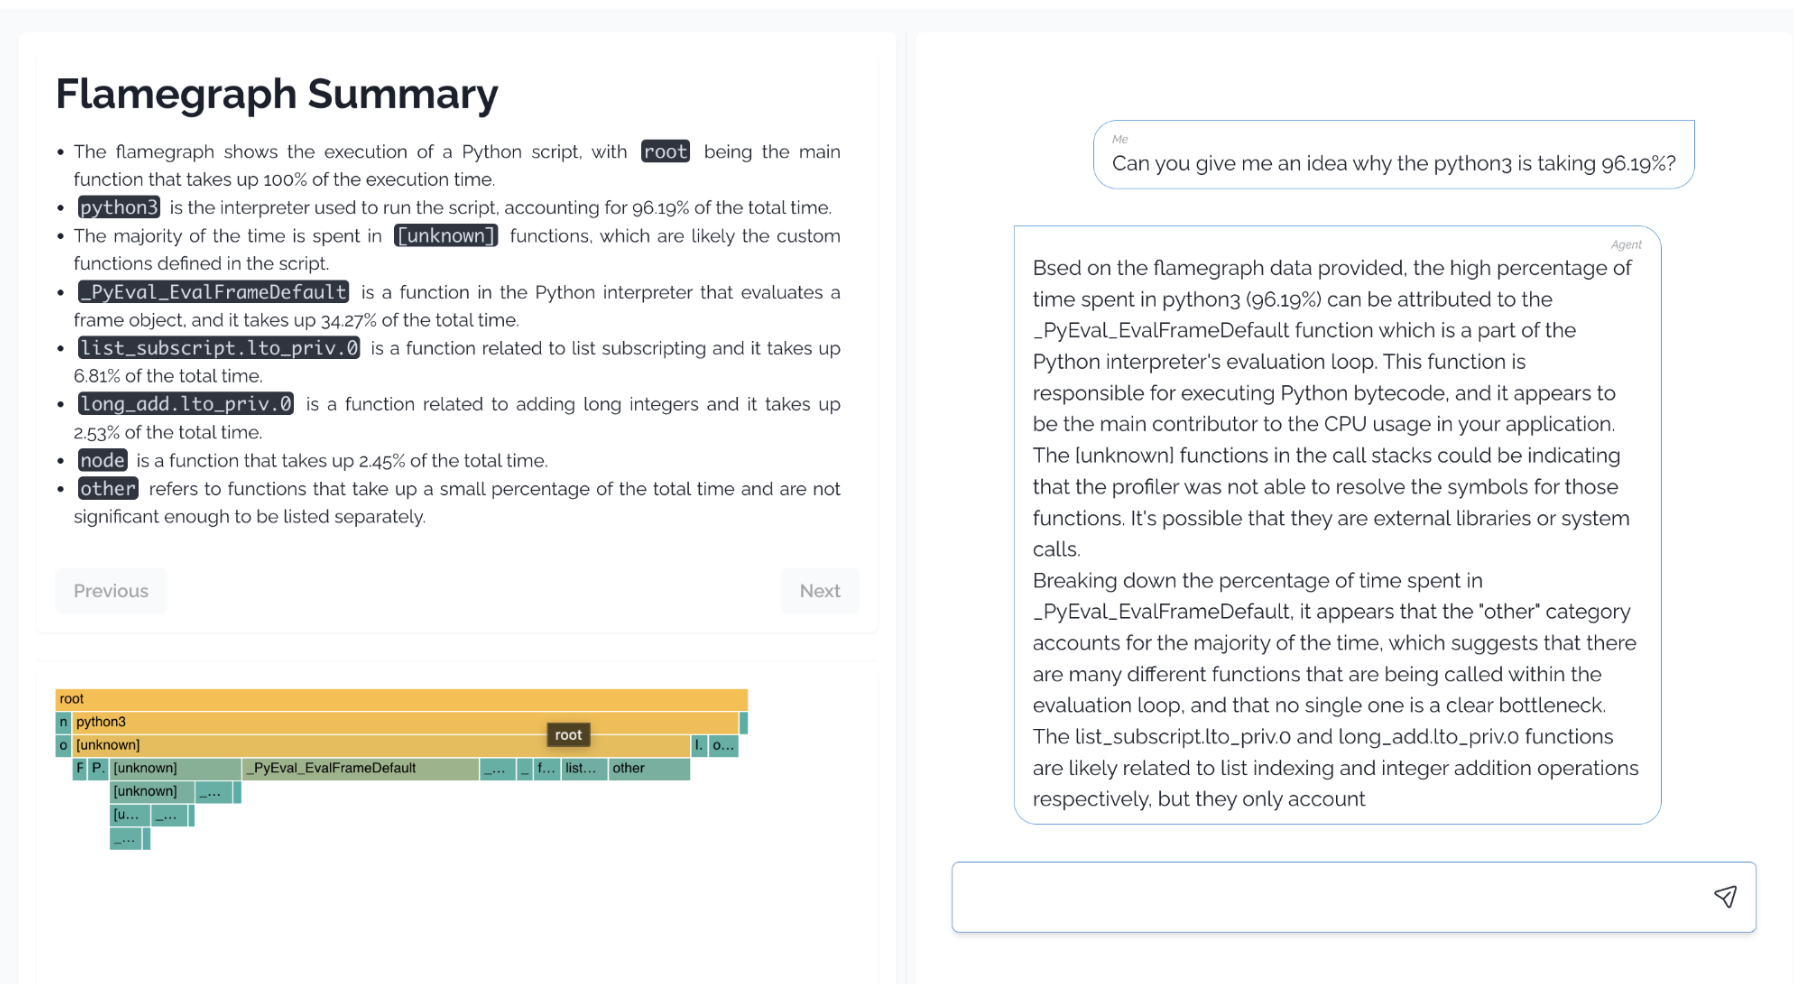
- Step-by-Step Explanation: For each segment of the flamegraph, the tool provides a detailed explanation, breaking down complex kernel space calls and debug symbols into understandable terms.
- Interactive Learning: Users can interact with different parts of the flamegraph to get more detailed insights about specific calls or processes.
- Democratization of Knowledge: By simplifying the interpretation of system call stacks, the tool makes it easier for high-level engineers to understand and optimize their systems without needing deep technical experience.